
Oobeya August 2022 Updates Summary
🎉 We are super excited to share our new features and improvements with you!
- TeamCity integration is ready!
- Calculate and track TeamCity DORA metrics!
- Oobeya Dashboard DORA Metrics Widget now displays all DORA Metrics!
- Exclude deployments to calculate DORA Metrics more accurately!
- Select Gitwiser analysis period to optimize analysis performance
- New Pull Request metrics are ready to use! Improve your teams' code review cycles!
- Manage Team Members easily!
🎁 NEW FEATURES
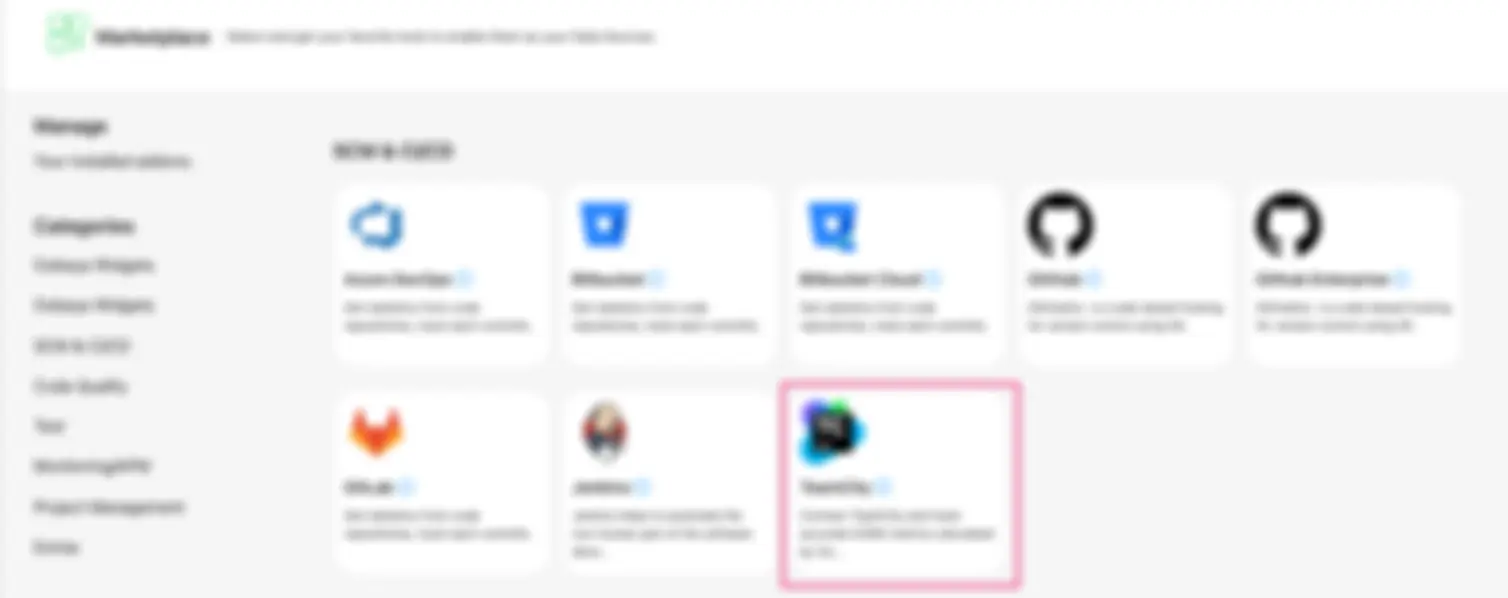
Oobeya TeamCity integration is ready!
If you're using TeamCity for your CI/CD needs, we have some great news for you - the Oobeya TeamCity integration is now available!
You can now calculate and track your TeamCity DORA metrics seamlessly; we think it's a great way to improve your CI/CD process.
 Oobeya TeamCity Addon
To get started, simply head over to our Marketplace page and activate the TeamCity addon. Then, add your TeamCity data source. Once you have it set up and started Oobeya Deployment Analytics, you'll be able to see your DORA metrics in Oobeya.
Oobeya Deployment Analytics works with GitLab CI, AzureDevOps, Jenkins, GitHub Actions, and TeamCity for now.
Coming soon: Spinnaker, BB Pipelines, Octopus, PagerDuty, OpsGenie, ServiceNow, and more...
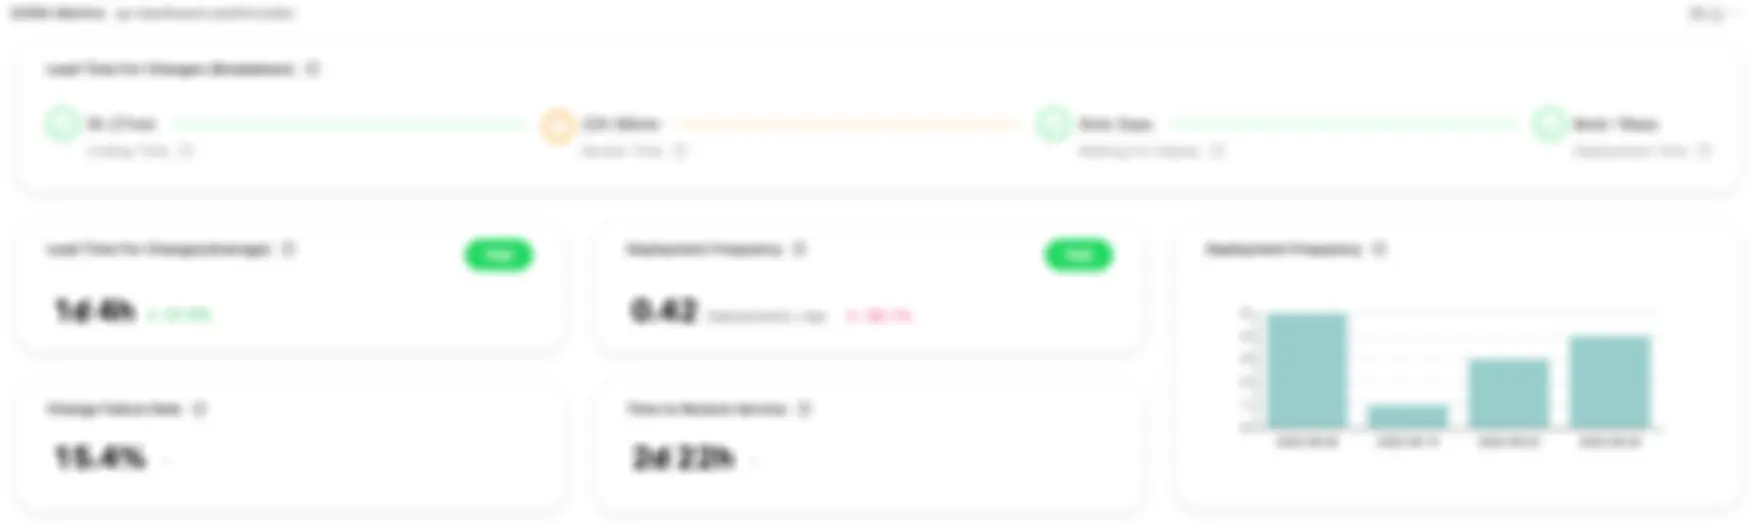
Oobeya Dashboard DORA Metrics Widget now displays all Four DORA Metrics!
We are excited to announce that the Oobeya Dashboard "DORA Metrics Widget" now displays all four DORA Metrics! This improvement makes it easy to track your progress against the four key indicators of the DevOps Performance Framework: Lead Time For Changes, Deployment Frequency, Change Failure Rate, and Mean Time to Restore Service.
 Oobeya DORA Metrics Widget
To access the DORA Metrics Widget, simply go to your Dashboard and click on the "Widgets" button in the top right corner. From Gitwiser > Deployment Analytics, you can add the DORA Metrics Widget to your Dashboard. We hope you find this new feature helpful in tracking your DORA Metrics!
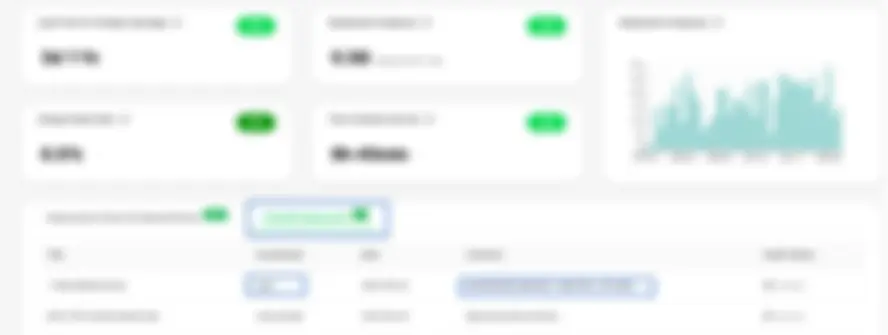
Exclude deployments to calculate DORA Metrics more accurately!
We're excited to announce a new feature for Oobeya Deployment Analytics - the ability to exclude deployments from your DORA Metrics calculations!
Previously, when calculating your Lead Time For Changes, any deployments that were considered anomalies would be included in the calculation. This could lead to inaccurate results and made it difficult to get an accurate picture of your development and delivery process.
Now, with the new deployment exclusion feature, Oobeya automatically excludes any deployments that are considered anomalies. Oobeya users are also able to exclude any deployment manually. This will give you a more accurate picture of your delivery process and help you identify and fix any issues more effectively.
 Oobeya DORA Deployment Exclusions
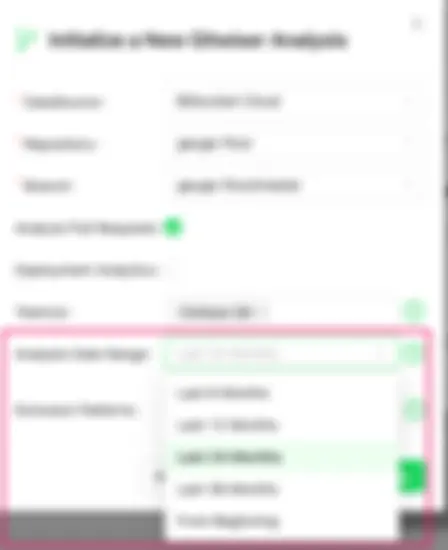
Select Gitwiser analysis period to optimize analysis performance
We are excited to announce a new feature for Oobeya - the ability to select the analysis period to optimize performance.
Gitwiser is a powerful git analytics tool that lets development teams see the impact and cognitive load of commits on the team average. It's been a valuable tool for development teams and leaders looking to improve their workflow and optimize their working practices.
With this new feature, you can select the period of time you want to analyze to get the most accurate results. This is especially helpful for large projects with a lot of history.
 Oobeya Git Analytics Date Range
See the other features below to optimize Gitwiser analysis performance:
- Commit Exclusions
- Source Code File and Folder Exclusions (exclusion patterns)
Manage Team Members easily!
Oobeya is excited to announce this new feature to help team leads manage their team members easily! With this new feature, team leads can add and remove members with ease, as well as receive smart suggestions on who to add or remove to their team. This new feature is designed to make managing teams easier and more efficient for Oobeya users.
New Key Pull Request metrics are ready to use! Improve your teams' code review cycles!
We've just released a new set of metrics for the Oobeya Pull Request Analytics module:
- Avg Time To Merge: The time elapsed between the first commit and merge time.
- % PRs Merged Within Goal: The percentage of merged pull requests within the specified team goal.
These key metrics will help you improve your team's code review cycles and performance.
 Key pull request metrics
💪 IMPROVEMENTS
- [Gitwiser] GitHub API Rate Limit improvements
- [Gitwiser] Bitbucket API Rate Limit improvements
- Performance improvements
- UI/UX improvements (on time in state widget, team search, date filter, and more...)
🏃 READY TO LEARN MORE?
Do you want to see all the new features in action and talk about the product roadmap?
Click and book a demo now.

