
Oobeya June 2022 Updates Summary
🎉 We are super excited to introduce you to our new features and improvements!
- DORA Stability Metrics -1: Change Failure Rate
- DORA Stability Metrics 2: Time to Restore Service
- Executive View & Organization-Wide Metrics
- Improvements on AgileSpace, Gitwiser, Sonarqube, and UI/UX
- Private Beta: Symptoms (cooking something special...)
🎁 NEW FEATURES
DORA Stability Metrics -1: Change Failure Rate
We have added Change Failure Rate to Oobeya Deployment Analytics [BETA]!
Change Failure Rate: The percentage of deployments causing a failure in production.
💡 Read more on Oobeya Blog: How to Measure DORA Metrics Accurately?
You can set your deployment status as a failure manually now.
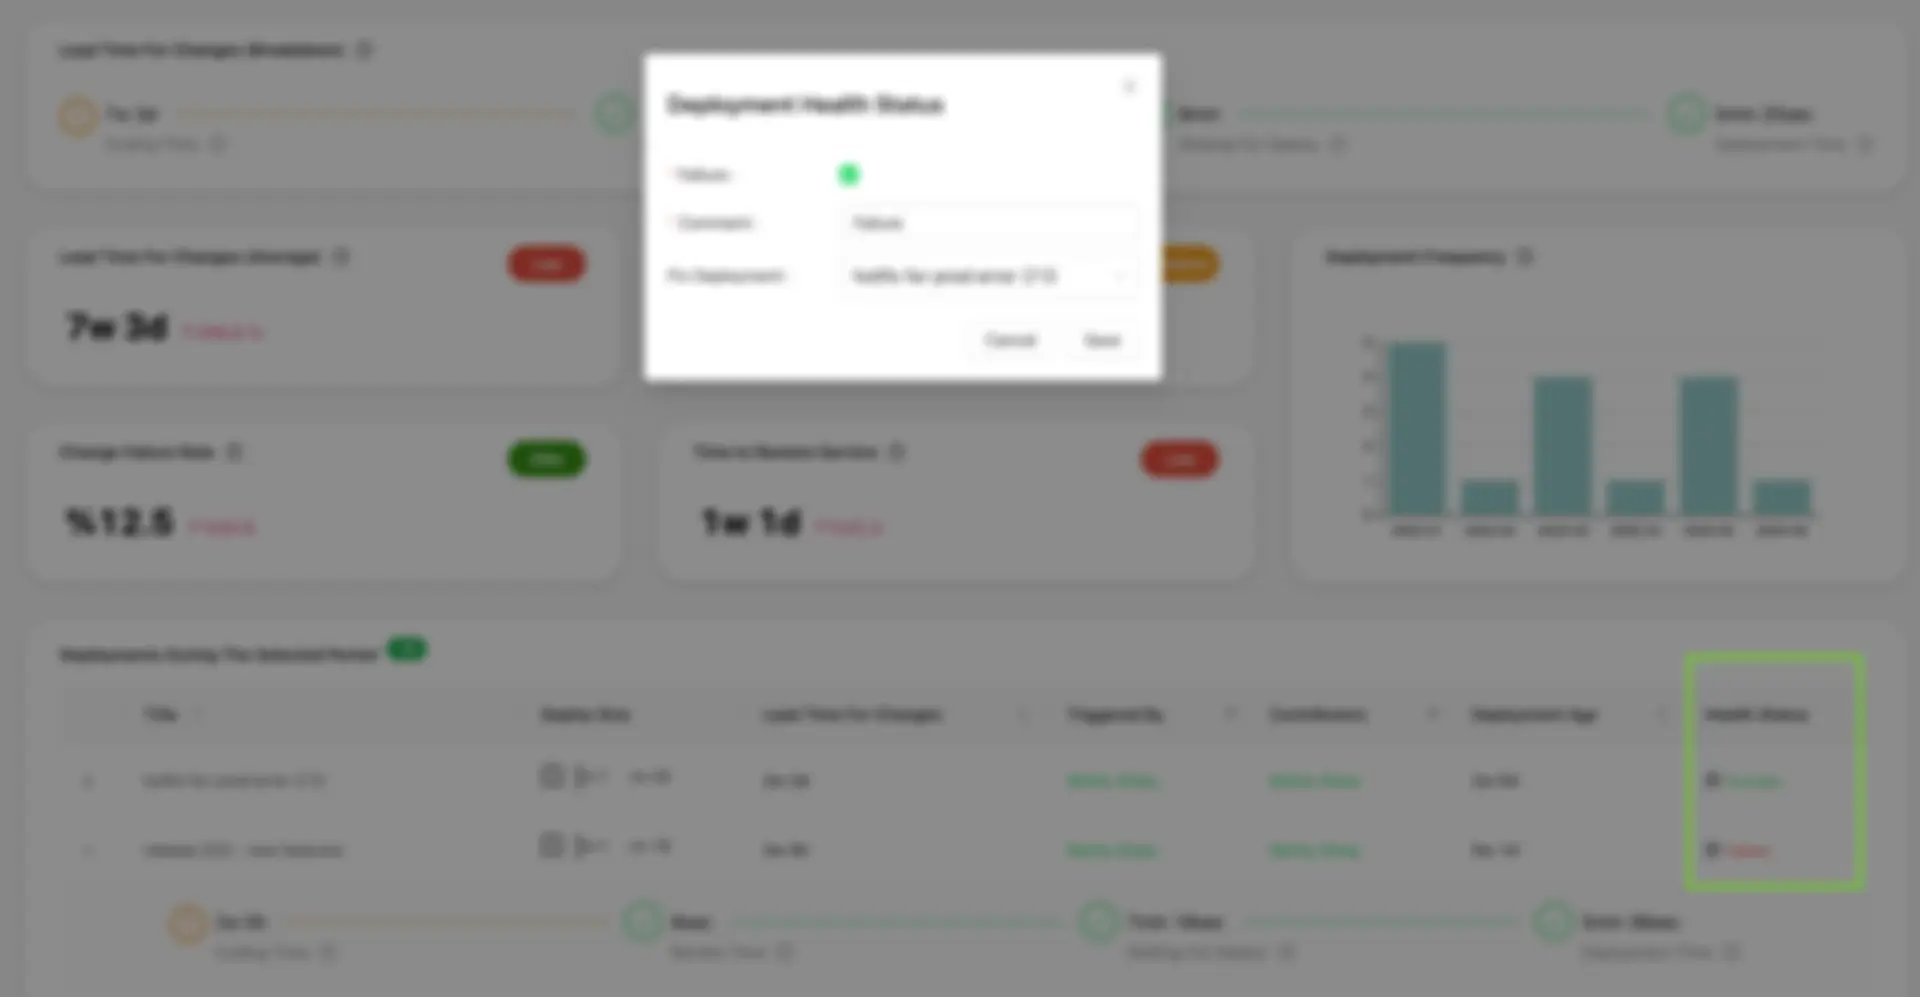 Setting deployment health status and fix deployment manually
In the next release, deployment failures will be detected automatically by Git tags and branch names.
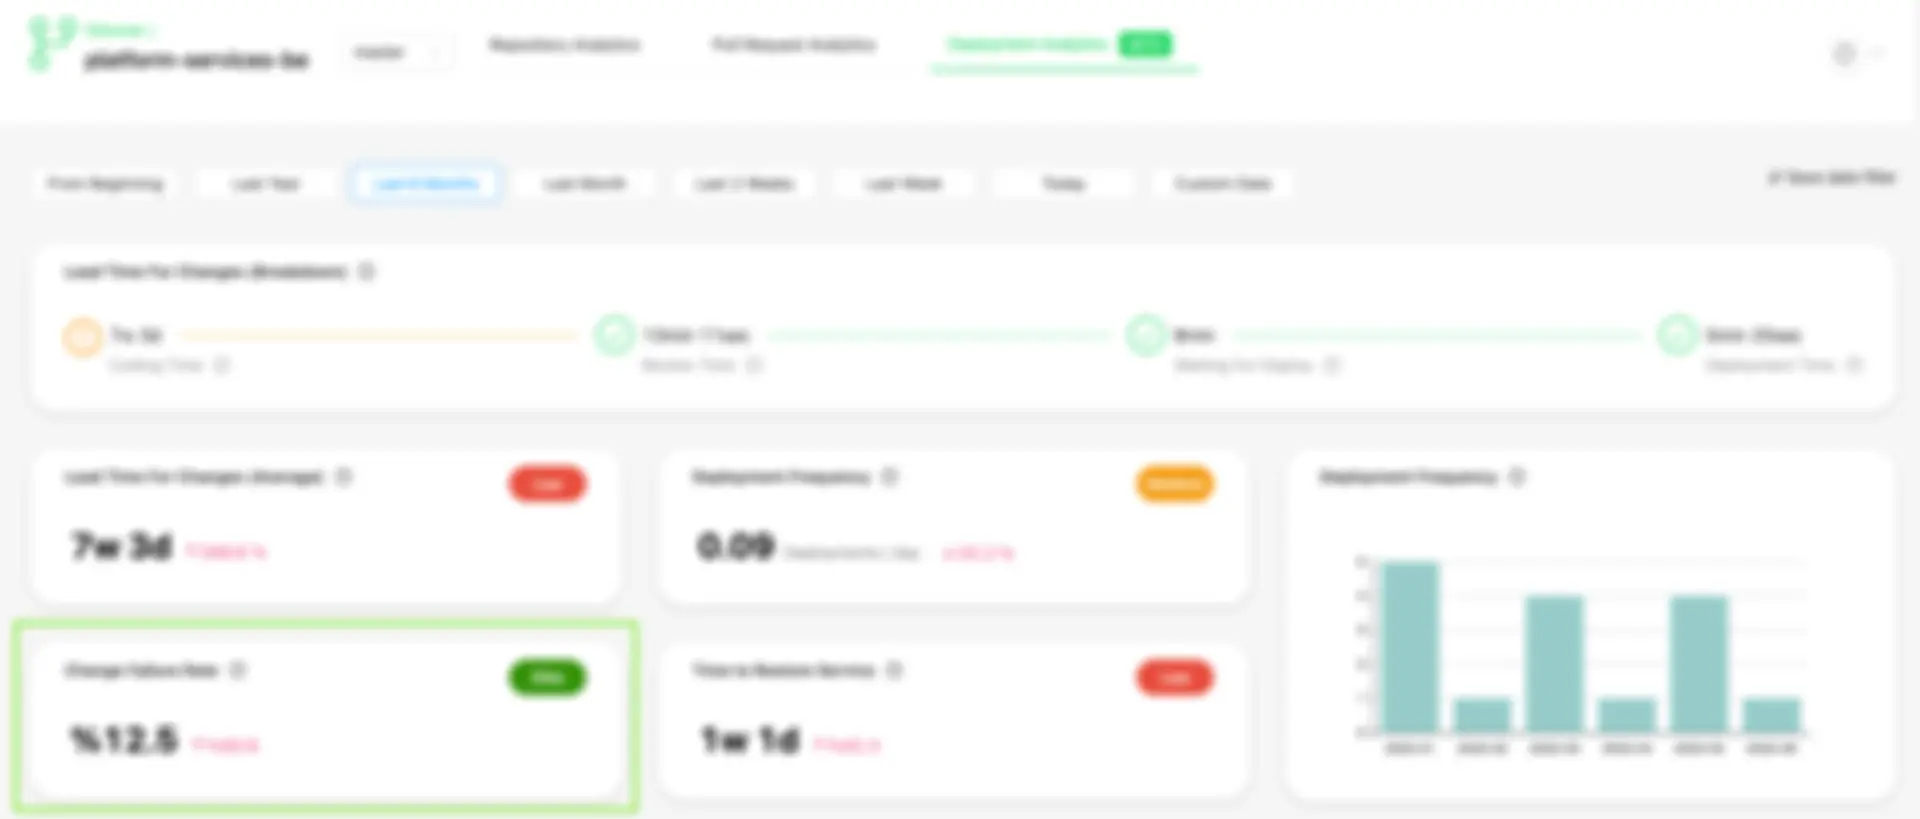 DORA Metrics - Change Failure Rate
Oobeya Deployment Analytics works with GitLab CI, AzureDevOps, Jenkins, and GitHub Actions for now.
Coming soon: TeamCity, Spinnaker, BB Pipelines, Octopus, PagerDuty, OpsGenie, ServiceNow, and more...
DORA Stability Metrics -2: Time to Restore Service
We have added the Time to Restore Service / Mean Time To Recovery (MTTR) metric to Oobeya Deployment Analytics [BETA]!
Time to Restore Service: How long it takes an organization to recover from a failure in production.
💡 Read more on Oobeya Blog: How to Measure DORA Metrics Accurately?
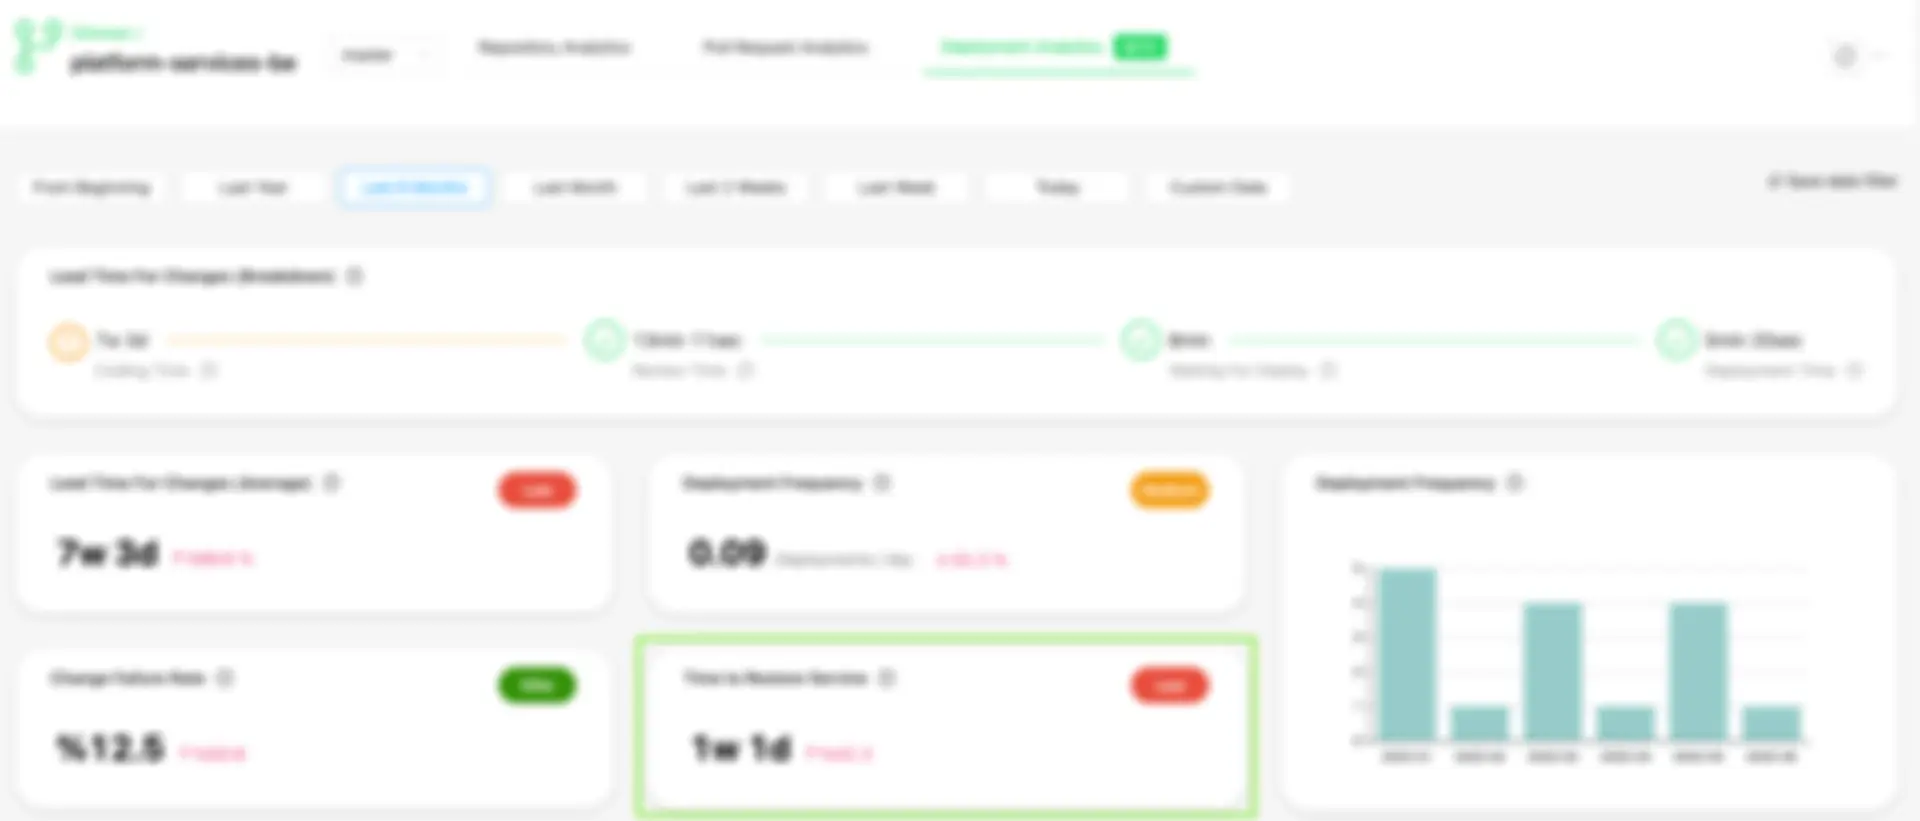 DORA Metrics - Mean Time To Recovery (MTTR)
Executive View & Organization-Wide Metrics
You can set your own Organization Schema to create a hierarchical view in Oobeya.
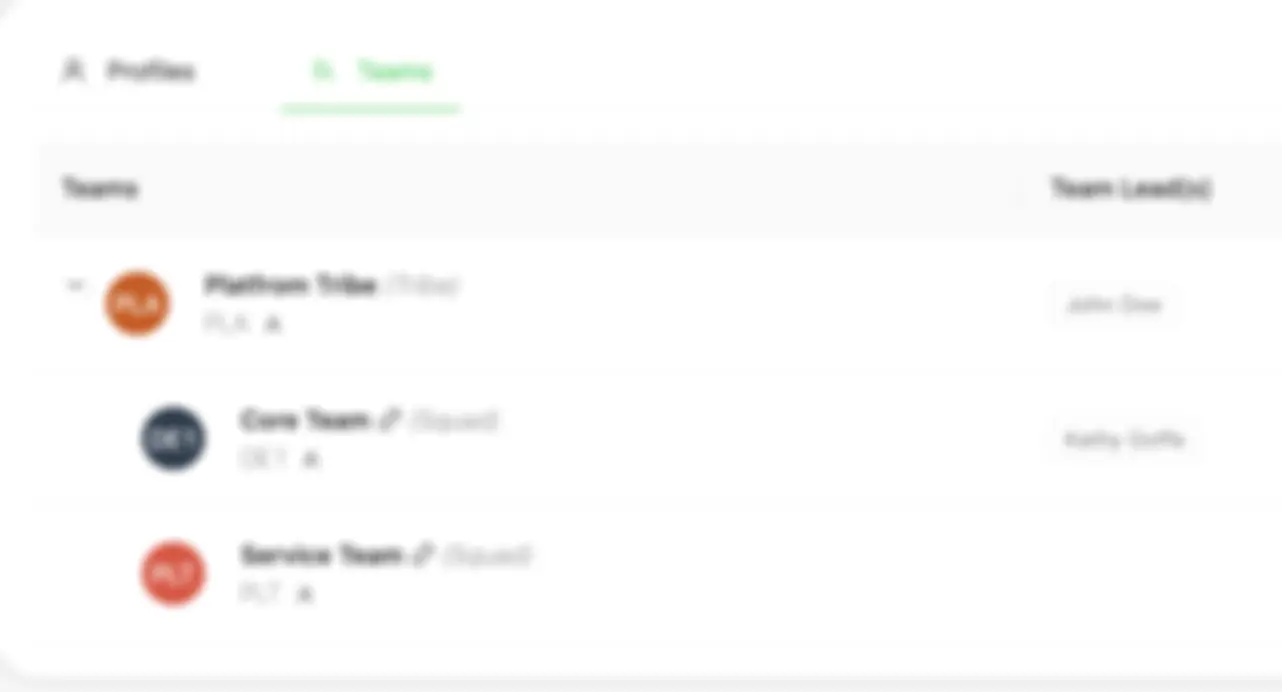 You can set your own Organization Schema to create a hierarchical view.
After you create your organization chart, you can view your organization-wide metrics with breakdowns. All the metrics shown will be customizable in this view.
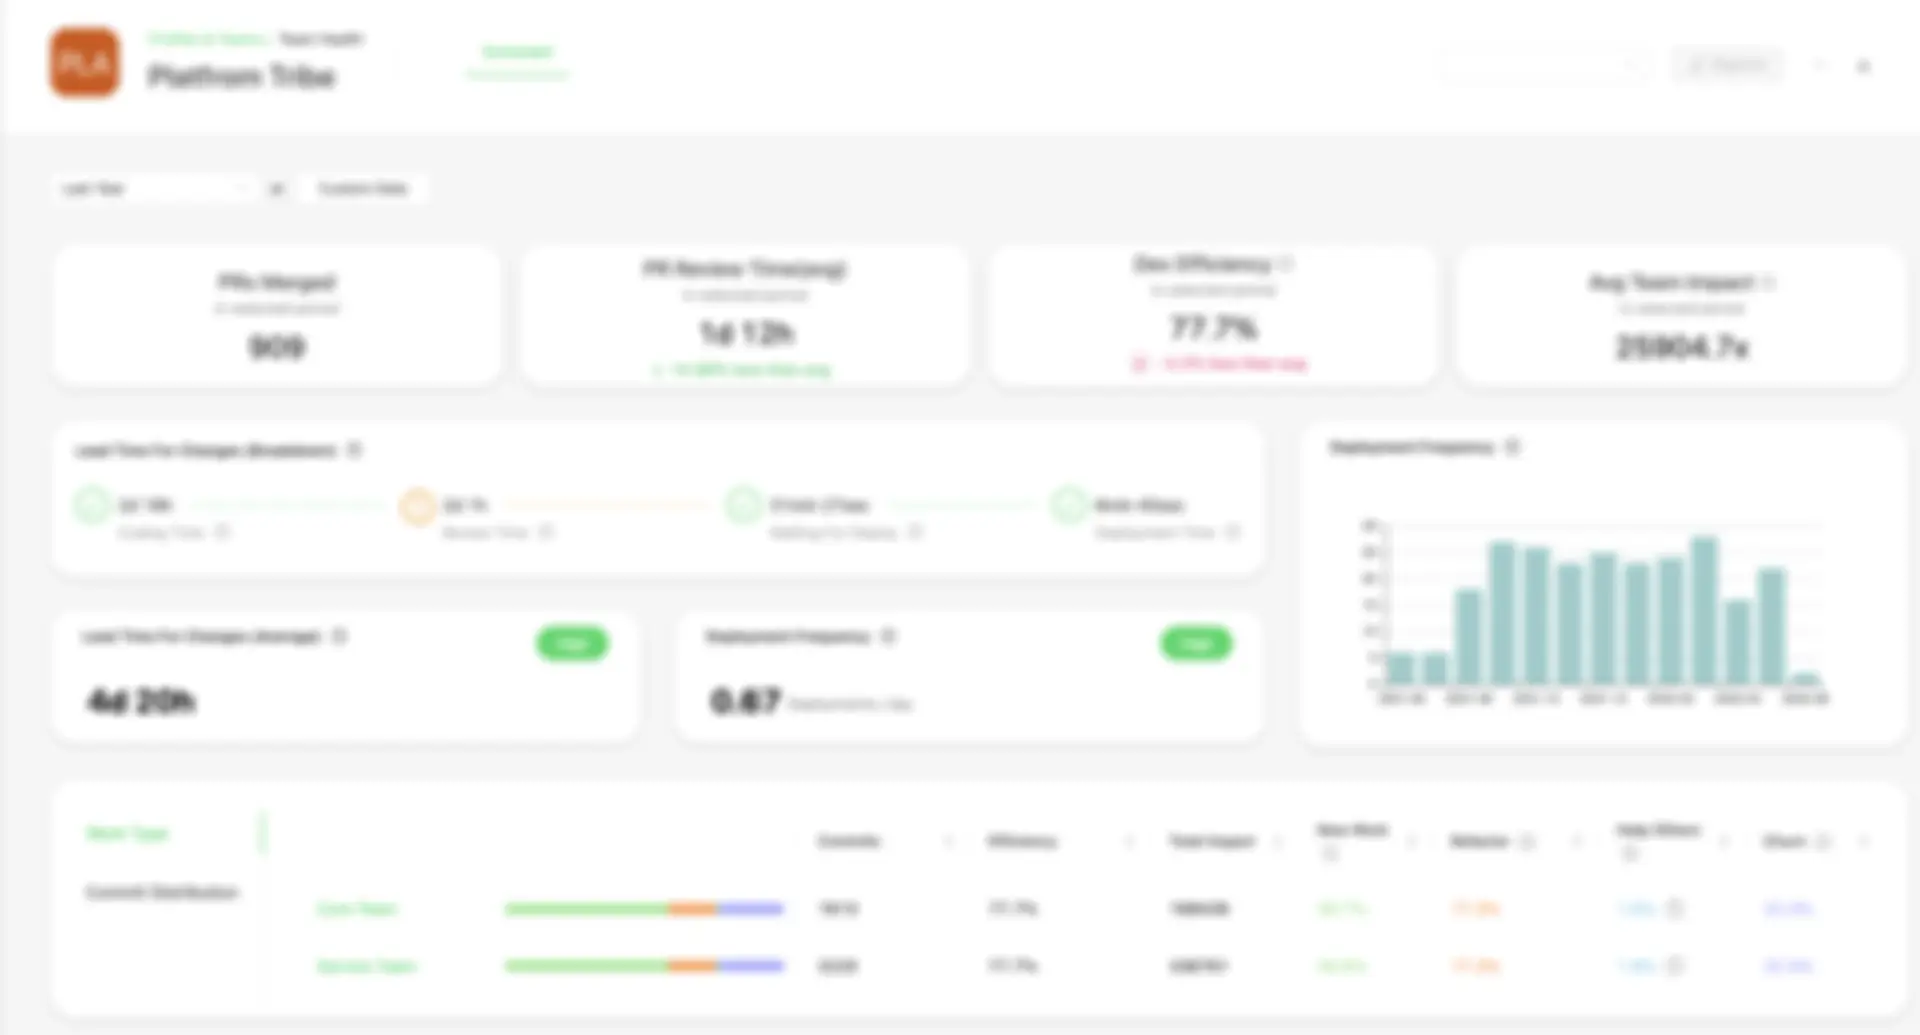 Organization-wide metrics along with breakdowns
💪 IMPROVEMENTS
- [AgileSpace] Added Total Story Points & Total Issue Count value to Sprint Reports
- [AgileSpace] Added a new tab to Sprint Velocity Metrics widget: "Team Members”
- [AgileSpace] Added task dropdown to Scope Changes widget
- [AgileSpace] Added a new configuration option for Azure DevOps Story Points / Effort fields
- [Gitwiser] Added automated-reanalyze feature for Pull Request Analysis
- [Sonarqube] Started hiding Sonarqube issues which are set as "won't fix" on Sonarqube
- Performance improvements
- UI/UX improvements
🔒 PRIVATE BETA - Cooking something special
We are currently working on a new module called "Symptoms".
Oobeya Symptoms module identifies automatically symptoms of software development and delivery processes.
20+ symptoms are ready-to-use and auto-detect unhealthy practices of development teams in private beta.
🏃 READY TO LEARN MORE?
Do you want to see all the new features in action and talk about the product roadmap?
Click and book a demo now.

