Developer Productivity
Insights Platform
Empowering engineering leaders to identify bottlenecks and improve developer productivity with data-driven insights from DORA Metrics, DX and SPACE frameworks.
Trusted by visionary engineering leaders around
the globe from startups to enterprises.
the globe from startups to enterprises.
Proven Track Record
Trusted by leading software organizations to improve developer productivity. Recognized as a Representative Vendor in Gartner market reports (2023, 2024, 2025), Category Leader in G2.
AI-poweerd Insight-Driven
Leverage actionable insights to make informed engineering decisions, accelerate time-to-market, and enhance software productivity and quality.
On-Premise Deployment Options
Customize your deployment to suit your needs: choose between on-premise installation or cloud deployment for complete flexibility.
Accurate Metrics. Actionable Insights.
Data-Driven Decisions.
Data-Driven Decisions.
Empowering engineering leaders with visibility into engineering metrics, detecting bottlenecks,
and improving developer productivity and engineering efficiency
through data-driven insights.

Your Stack. Your Processes.
Our Insights.
Our Insights.
Oobeya seamlessly integrates with your existing SDLC and project
management toolset, transforming your data into key engineering
metrics, dashboards, and providing the insights you need to make data-driven decisions.
View All IntegrationsOobeya is the best DORA Metrics
tool for you
Oobeya has a unique mechanism for calculating DORA Metrics across tools (VCS, CICD, and APM/Incident Management) so that any organization can accurately and effortlessly track the journey of a commit from development to production deployment. Furthermore, no changes to workflows or pipelines are required; Oobeya seamlessly integrates with existing tools to calculate the most accurate DORA metrics.
Explore DORA Metrics
Why is Oobeya the right tool for Engineering Leaders?
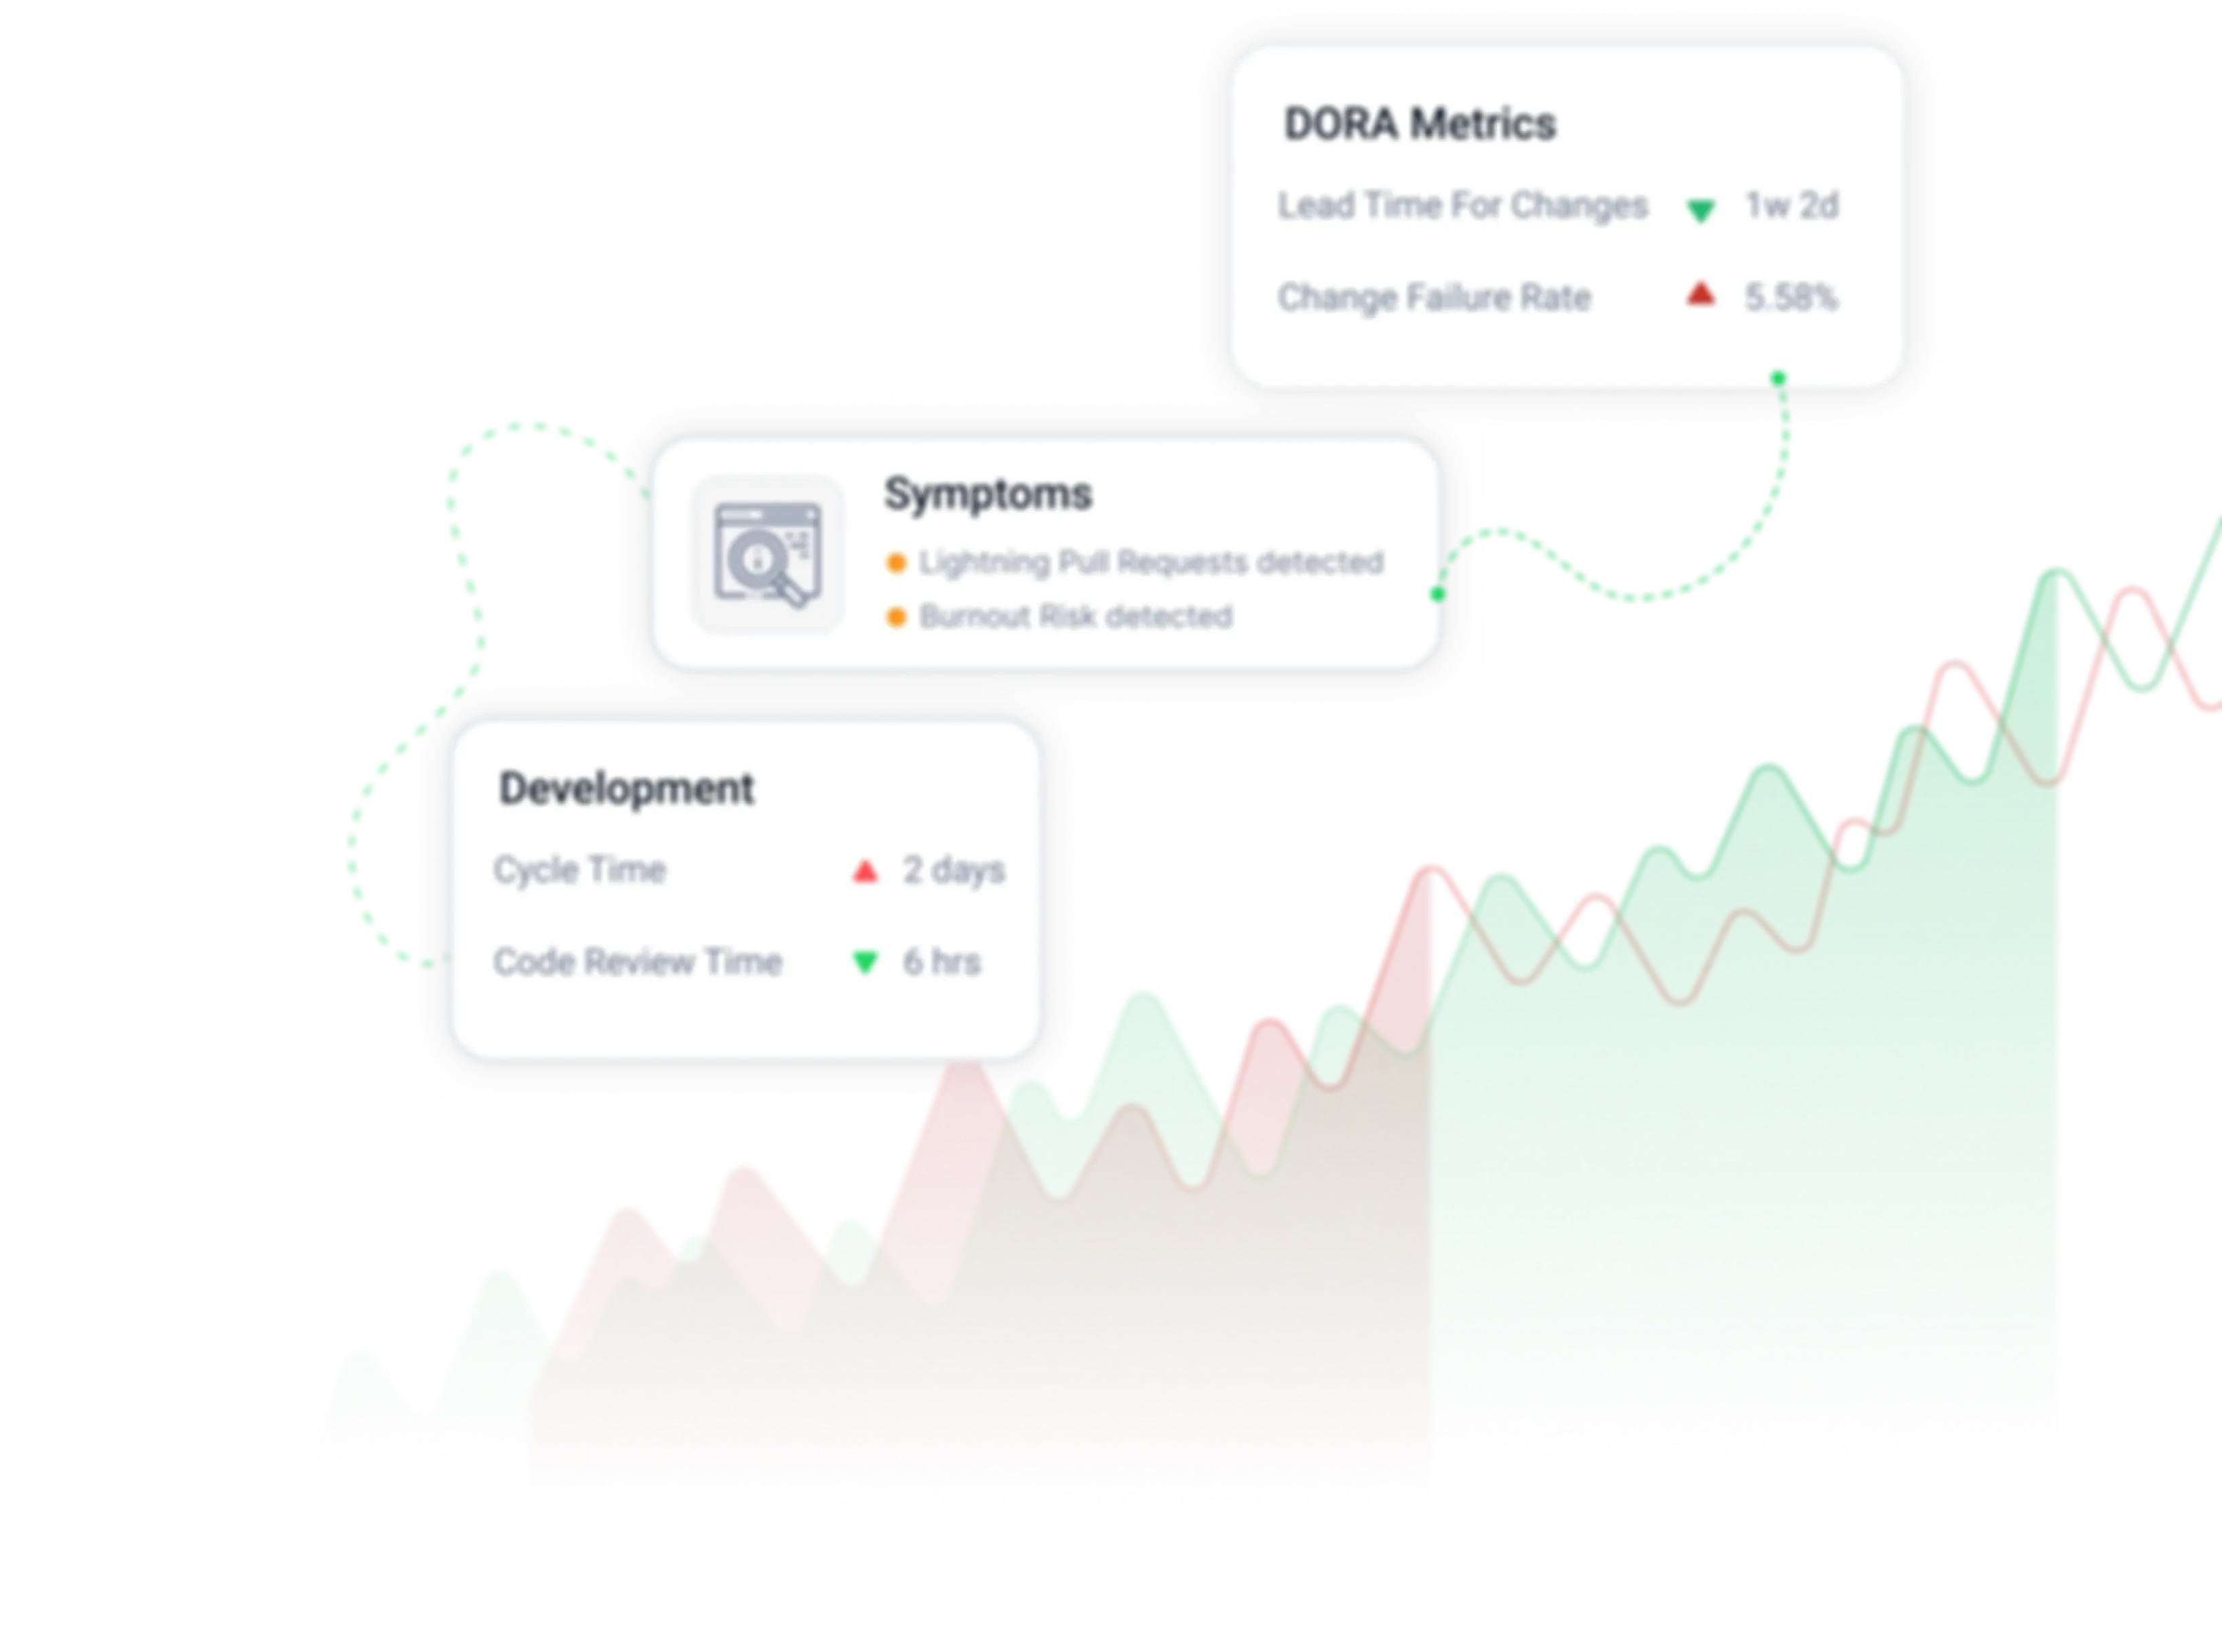
Oobeya stands out with its innovative approach to automatically detecting and addressing development and delivery symptoms.
By leveraging key engineering metrics and hundreds of data points, this unique capability enables software organizations to
effortlessly identify recurring anti-patterns, bottlenecks, and roadblocks.
With actionable insights derived from in-depth metric analysis, Oobeya empowers teams to take proactive
steps toward optimizing their processes and cultivating healthy, effective teams.
Product Tour Check out our Blog Posts
Explore our featured blog posts.
Oobeya, Inc. @ 2025
version: v1.0.1733


