Detecting production failures is the most critical and challenging component of tracking DORA metrics. While it can be challenging, organizations can overcome these challenges by using the right tools and following best practices.
Quick Intro: What Are DORA Metrics?
DORA (DevOps Research and Assessment) metrics are a set of metrics that measure the performance of DevOps practices and processes in organizations. The metrics include lead time, deployment frequency, mean time to restore, change failure rate, and they aim to provide a comprehensive view of an organization’s ability to deliver value to customers. Learn more about DORA Metrics here: https://oobeya.io/blog/how-to-measure-dora-metrics-accurately/
What Is A Production Failure?
One critical component of tracking DORA metrics is detecting production failures. Production failures occur when a change to the software system results in an unintended outcome, causing the system to malfunction or become unavailable. These failures can significantly impact the stability and reliability of software systems, making it crucial for organizations to detect and resolve them as quickly as possible.
The Most Challenging Part of DORA Metrics Tracking: Detecting Production Failures
However, detecting production failures can be a challenging task for organizations. One of the biggest challenges is automatically detecting production failures, which can be difficult due to the complexity of software systems and the limited visibility into production systems. Additionally, organizations are often overwhelmed by the sheer volume of data to be analyzed, making it difficult to identify and resolve failures quickly.
To overcome these challenges, organizations can use a variety of solutions and tools to detect production failures, including monitoring, log analysis, error tracking, user feedback, performance testing, change, and incident management. These tools can provide organizations with real-time insights into the performance and stability of their systems, allowing them to quickly detect and resolve failures.
In addition to using the right tools, organizations can also follow best practices for detecting production failures. These best practices include conducting regular health checks and setting up real-time alerts. By following these best practices, organizations can improve their ability to detect production failures and improve the stability and reliability of their software systems.
How Oobeya Detects Production Failures and Calculates Change Failure Rate + MTTR
Oobeya is a software engineering intelligence platform that allows software development organizations to gather and analyze data from various sources to make informed decisions and optimize their development and delivery processes.
Oobeya is also a DORA Metrics Tracking tool that provides valuable insights into the effectiveness of software development and delivery.
Oobeya has a unique mechanism for calculating DORA Metrics across platforms/tools (VCS, CICD, and APM-Incident Management tools) so that any organization can accurately and effortlessly track the journey of a commit from development to production deployment. Furthermore, no changes to workflows or pipelines are required; Oobeya seamlessly integrates with existing tools (GitHub, GitLab, Azure DevOps, Bitbucket, Jenkins, TeamCity, GitHub Actions, GitLab CI, Azure Pipelines, Releases, and more) to calculate DORA metrics.
Oobeya analyzes all deployments, detects production failures, and ties them back to production deployments.
Oobeya calculates all four key DORA Metrics. The Change Failure Rate (CFR) is the percentage of deployments causing a failure in production. This metric provides a clear and concise representation of the stability and reliability of software systems. Oobeya uses the health status of each deployment to calculate the CFR metric.
 Oobeya DORA Metrics — Change Failure Rate CFR
In Oobeya, each analyzed production deployment has a health status, which is either Success or Failure. Oobeya sets the health status of each deployment by using four methods: manual health status setting, API call, hotfix pattern detection, and tracking incidents from APM/Incident Management tools.
1- Setting health status manually
In this method, the health status of each deployment is set manually by a user. This method is useful when there is a need for verification, for example, when there is a complex deployment that involves multiple systems and applications or where you don’t have any mechanism to detect and track failures automatically by the tools.
 Setting deployment health status manually
2- Setting health status via an API call
Oobeya provides an API that can be used to set the health status of each deployment.
3- Detecting hotfix naming patterns in the branch name, PR, and deployment title
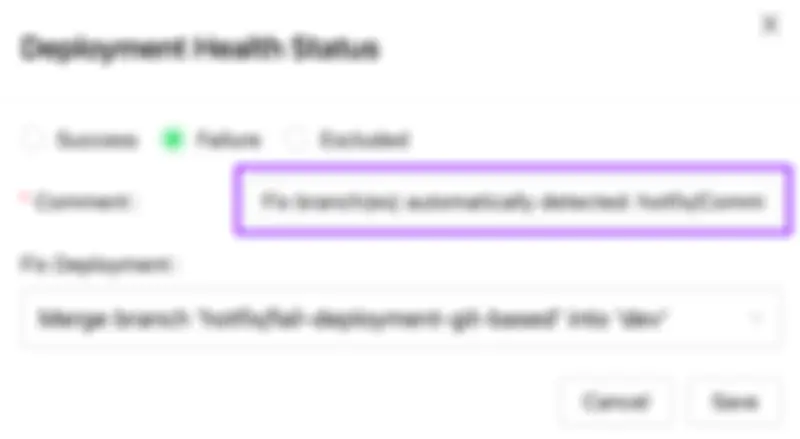
To identify hotfix deployments, Oobeya looks for naming patterns in the branch name, Pull Request title, and deployment title. Because hotfix deployments are used to fix critical production issues, Oobeya sets the health status of previous deployments to Failure.
 Setting naming patterns
 Automatically detected Failure
4- Tracking incidents from Application Performance / Incident Management tools
Oobeya integrates with Application Performance Management (APM) and Incident Management tools to track incidents in production. If these tools detect an incident in production, Oobeya sets the health status of the most recent deployment prior to the incident to Failure.
 Oobeya — DORA Metrics Incident Source
 Automatically detected by tracking New Relic Incidents and Alerts
P.S. New Relic is ready to use, and DataDog, Sentry, Dynatrace, PagerDuty, OpsGenie, ServiceNow, and more are coming soon.
In addition to automatically and manually setting the health status of deployments and calculating the CFR, Oobeya also provides other three key DORA Metrics and detailed insights into each deployment. This includes information about the deployment time, deployment size (small, medium, large, and gigantic), contributors, and the link to the deployment pipeline. You can group multiple analyses to get a holistic view of DORA Metrics across your organization in the Oobeya Engineering Intelligence Platform.
In conclusion, detecting production failures is the most critical and challenging component of tracking DORA metrics. While it can be challenging, organizations can overcome these challenges by using the right tools and following best practices. By improving their ability to detect and resolve production failures, organizations can deliver value to customers more effectively and improve the overall performance of their DevOps practices.

