Agile methodologies are revolutionizing how teams work, but even the best practices can fall short without the right tools. Oobeya's Agile Board Analytics module (AgileSpace) offers an unparalleled solution to enhance your Agile practices by providing deep insights into your planning, development, and delivery processes.
Understanding the Basics of Oobeya's Scrum Boards Analytics
At its core, Oobeya’s AgileSpace analyzes all work items and tickets on an Agile board, generating crucial metrics to help teams understand and improve their processes. By leveraging these metrics, teams can detect process symptoms and take proactive measures.
Integrating Oobeya Scrum Boards with Your Agile Workflow
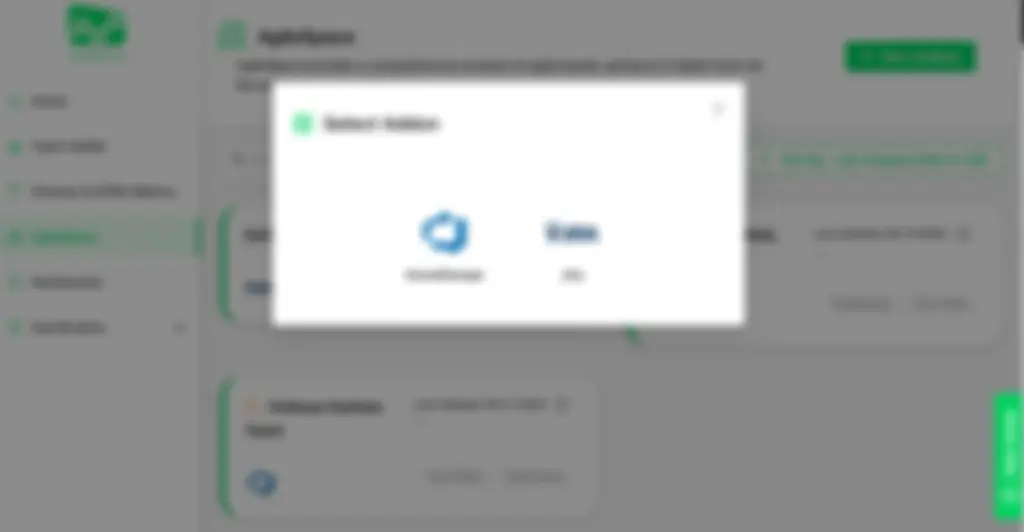
Integrating Oobeya Scrum Boards into your Agile workflow is seamless. Whether you're using Jira scrum boards or Azure Boards, Oobeya's comprehensive suite of tools can elevate your Agile practices. Syncing with your existing tools, Oobeya ensures you get the most accurate and relevant insights.
 Oobeya Agile Analytics
Customizing Your Scrum Board Analytics for Maximum Efficiency
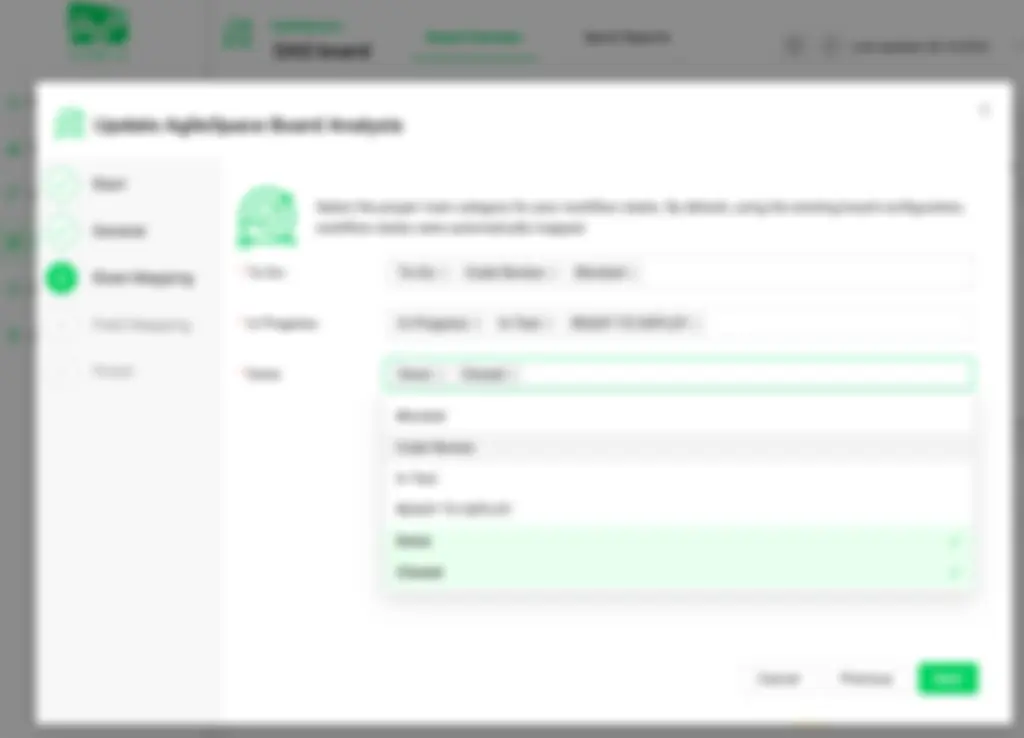
Customization is key to accurate Agile metrics. Oobeya allows dynamic state mapping of each scrum board, ensuring precise analysis tailored to your specific workflow. The status mapping feature lets users adjust workflows on Oobeya, while the effort field mapping feature allows selecting the proper effort fields like story points, original estimates, or custom fields.
 Oobeya Scrum Board State Mapping
Advanced Features of Oobeya's Scrum Boards to Boost Productivity
Oobeya offers several widgets that display various metrics:
- Summary Widget: Basic view of your board (name, type, average stats, etc.).
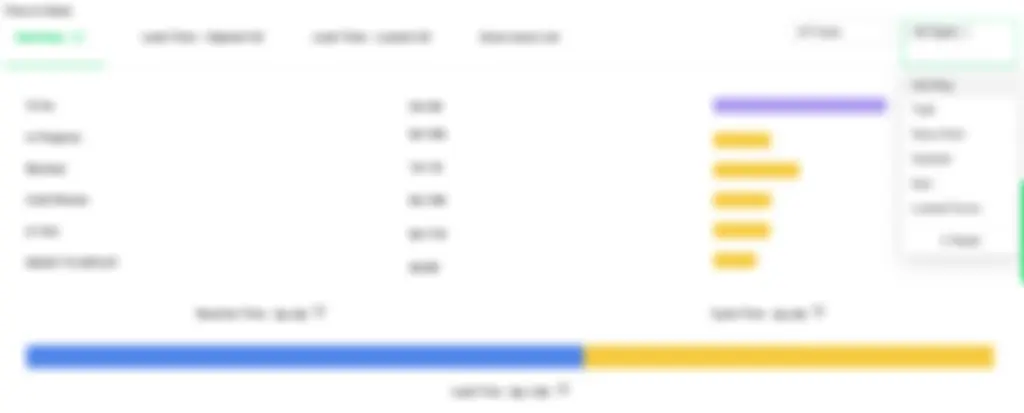
- Time in State Widget: Average time a task stays in each state. This widget includes Summary, Lead Time Highest 50 & Lowest 50, and Done Issue List views.
- Sprint Velocity Metrics Widget: Velocity measurements of work completed in a Sprint.
- Assignee List Widget: Activities of all assignees on the board.
- Work In Progress Widget: Issues open for more than 5 days.
- Scope Change Widget: Changes (removed and added tasks) after the sprint starts (item count and effort).
- Estimated/Actual Effort Widget: Shows the accuracy of the estimations provided by the team (Estimated Effort/Actual Effort). This graph is used to understand the root cause of divergence.
These features not only help in tracking but also in identifying areas for continuous improvement, ensuring that your team is always on the path to enhanced productivity.
Detailed Overview of Key Scrum Metrics and Reports
The Summary Report gives an overarching view of completed sprints, average sprint velocity, lead time, and cycle time. It helps teams quickly grasp their overall performance and identify areas for improvement.
Time in State:
- Tracks the average time tasks stay in each state before completion.
- Helps teams identify bottlenecks and streamline processes.
- Reaction Time: Reaction time is the measurement of how much time a task stays in 'Not started' (to do, backlog, etc.) states.
- Cycle Time: Cycle time is the measurement of how much time passes between work started on an item (story, task, bug, etc.) until it’s ready for delivery. (Work started -in progress- to work completed.)
- Lead Time: Lead time is the measurement of how much time passes between task creation and when the work is completed. (Task created to work completed.)
 Oobeya Time In State
Sprint Velocity Metrics:
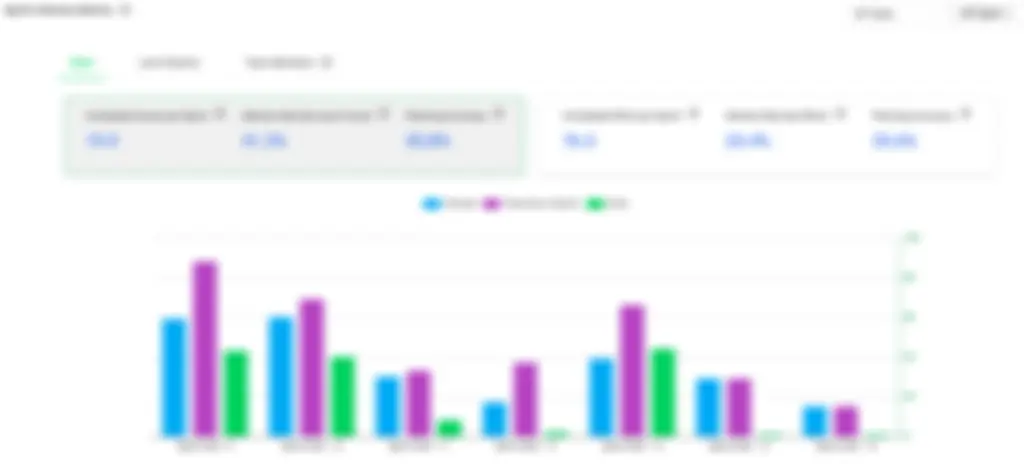
- Shows completed issues per sprint, delivery rate by issue count and effort, planning accuracy, and completed effort per sprint.
- Provides a visual representation of planned vs. done work items over multiple sprints.
 Sprint Velocity
Assignee List:
- Displays all team members and their activities, helping to balance workload distribution, identify high performers, and identify red flags for overloading risks.
Work In Progress:
- Lists open issues that have been in progress for more than five days.
- Highlights potential blockers that need attention.
Sprint Scope Change:
- Tracks changes during the sprint, showing added and removed issues after the sprint starts.
- Provides insights into how scope changes impact sprint performance.
Estimated/Actual Effort:
- Depicts the time spent on issues versus the estimated effort.
- Helps teams improve estimation accuracy and manage capacity better.
Measuring Success and Continuous Improvement with Oobeya's Analytics
Success in Agile is not just about completing sprints but continuously improving with each iteration. Oobeya's comprehensive analytics provide a deep dive into sprint performance, enabling teams to pinpoint strengths and identify areas needing improvement. With detailed metrics like Sprint Velocity, Assignee Statistics, and Issue Distribution, Oobeya empowers teams to make data-driven decisions. These insights foster a culture of continuous improvement, ensuring that every sprint is more efficient and productive than the last. By leveraging Oobeya's analytics, Agile teams can elevate their practices, enhance collaboration, and consistently achieve their goals.
Ready to transform your Agile workflow?
Enhance your agile methodology with Oobeya Scrum Boards. Optimize your software engineering today and take the first step towards streamlined workflows, improved collaboration, and effortless productivity.
By leveraging Oobeya's agile analytics module, you can elevate your Agile practices to new heights. Whether you're looking to better understand your current processes or seeking ways to optimize for the future, Oobeya provides the tools and insights you need to succeed.
Fill out this form and get started with Oobeya now!

