We’ll explore the correlation between team symptoms and DORA Metrics and how addressing symptoms can help teams boost their software delivery performance. Take your team's productivity and well-being to the next level with this insightful guide.
Software development is a challenging and constantly evolving field that requires a high level of teamwork, collaboration, and productivity. To measure the effectiveness of their development processes, teams often turn to DORA (DevOps Research and Assessment) metrics, which are industry-standard measures of software delivery performance. However, measuring DORA Metrics alone is not enough to improve software development processes. To truly thrive, teams need to identify and address the root causes of all issues affecting their metrics.
This is where symptoms come in. Symptoms are indicators of underlying problems in the development process that can lead to poor DORA metrics. By identifying and addressing symptoms, teams can improve their development processes and, in turn, improve their DORA metrics. In this article, we’ll explore the correlation between team symptoms and DORA Metrics and how addressing symptoms can help teams boost their software delivery performance.
Oobeya Symptoms Overview
The Oobeya Symptoms module is a powerful tool for identifying and resolving problems in software development and delivery processes. In Oobeya, a symptom is a recurring anti-pattern, bad practice, bottleneck, or roadblock in the software development and delivery process.
 Oobeya Team Symptoms
Symptoms are automatically detected by Oobeya, leveraging over 50 key engineering metrics, and can be used to identify areas where improvements can be made to the software development and delivery process. By addressing the underlying causes of these symptoms, teams can improve their software development and delivery processes and achieve better outcomes.
Optimizing Team Performance in Software Development with Oobeya Team Health Module: https://oobeya.io/blog/optimizing-team-performance-in-software-development/
Understanding DORA Metrics
As software development teams strive to improve their processes and deliver high-quality products quickly, it’s important to have a way to measure progress and identify areas for improvement. DORA metrics are a set of four key performance indicators that can help teams measure their delivery performance.
 Oobeya DORA Metrics
How to Measure DORA Metrics Accurately: https://oobeya.io/blog/how-to-measure-dora-metrics-accurately/
Symptoms That Affect DORA Metrics
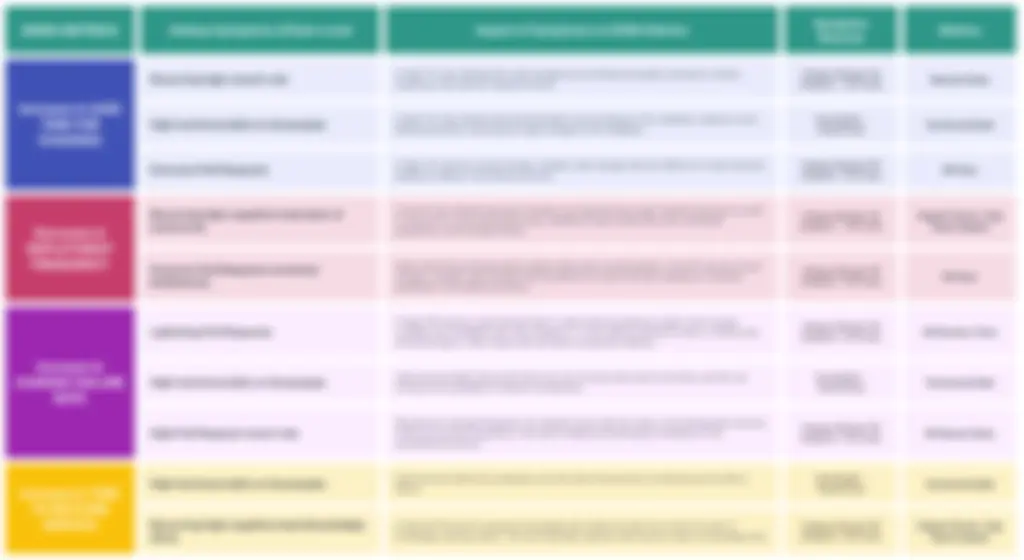
Symptoms are indicators of problems or inefficiencies in your software development process. Various symptoms can impact DORA metrics. Some of the most common symptoms include a recurring high rework rate, high technical debt on SonarQube, oversize pull requests, a high cognitive load, lightning pull requests, and a high pull request revert rate. These symptoms can slow down team performance and impact DORA metrics in various ways.
Symptoms can have a significant impact on DORA metrics. For example, having high technical debt and complexity can increase lead time for changes, while oversize pull requests can decrease deployment frequency. Lightning pull requests and having high code quality bugs can increase the change failure rate and time to restore service. By understanding the relationship between symptoms and DORA metrics, teams can take proactive measures to improve performance.
 Symptoms that affect DORA Metrics
Here are some examples of how the DORA metrics are correlated with specific symptoms:
1. Lead Time For Changes (LTC)
This measures the amount of time it takes a commit to get into production. The best thing you can do to reduce Change Lead Time is to identify software development waste and bottlenecks. Lead Time for Changes is correlated with the following symptoms:
- Recurring high rework rate: A high LTC may indicate that code changes are not being thoroughly reviewed or tested, resulting in the need for frequent rework. Learn more about this symptom here. High technical debt on Sonarqube: A high LTC may indicate that technical debt is accumulating in the codebase, making it more difficult and time-consuming to make changes in the codebase. Learn more about this symptom here.
- Oversize Pull Requests: A high LTC may be a result of large, complex code changes that are difficult to review and test, leading to delays in the delivery process. Learn more about this symptom here.
How To Reduce Lead Time for Changes (Optimizing DORA Metrics): https://oobeya.io/blog/how-to-reduce-lead-time-for-changes-dora-metrics/
2. Deployment Frequency (DF)
This measures how often code changes are deployed to production. Deployment Frequency is correlated with the following symptoms:
- Recurring high cognitive load: A low DF may indicate that team members are experiencing a high cognitive load due to a lack of resources or poor planning process, leading to lower productivity, poor developer experience, and increased stress. Learn more about this symptom here.
- Oversize Pull Requests: High-performing software teams release often and in small batches. A low DF may also be a result of large, complex code changes that are difficult to review and test, leading to a reviewer bottleneck in the delivery process. Learn more about this symptom here.
3. Change Failure Rate (CFR)
This measures the percentage of deployments causing a failure in production. The failures can significantly impact the stability and reliability of software systems, making it crucial for organizations to detect and resolve them as quickly as possible. Change Failure Rate is correlated with the following symptoms:
- Lightning Pull Requests: A high Change Failure Rate may be a sign that the team’s code review procedure is weak, which causes unstable and unreliable code. Pull Requests merged in 1–2 min without sufficient review or testing may introduce bugs or other issues that can lead to production failures. Learn more about this symptom here.
- High Technical Debt on Sonarqube: High technical debt means that there are a lot of issues that need to be fixed, and this can increase the probability of failures in production. Learn more about this symptom here.
- High Pull Request Revert Rate: Pull Requests that are reverted frequently can indicate issues with the code or the development process. If Pull Requests are reverted frequently, it can lead to delays and decreased confidence in the development process.
DORA Metrics Tracking: How to Effectively Detect Production Failures & Calculate Change Failure Rate: https://oobeya.io/blog/dora-metrics-tracking-how-to-effectively-detect-production-failures/
4. Mean Time to Restore Service (MTTR)
This measures how long it takes to restore service after a production incident. Time to Restore Service is correlated with the following symptoms:
- High Technical Debt on Sonarqube: High technical debt and complexity can slow down the process of restoring service after a failure.
- Recurring high cognitive load: A high MTTR may be caused by knowledge silos within the team as a result of a lack of knowledge-sharing culture. The recurring high cognitive load may be a sign of knowledge silos.
Improving Team Health and Performance By Leveraging Auto-detected Symptoms and DORA Metrics
To optimize team performance, it is crucial to identify and address symptoms that hinder productivity and teamwork. Fortunately, teams can leverage a range of tools and strategies to pinpoint such symptoms, such as Oobeya, which can automatically detect them based on predefined rules. Once identified, teams can take necessary actions to address the symptoms, including improving the code review process, reducing technical debt, and establishing clear knowledge-sharing procedures. By spotting and addressing symptoms, teams can improve DORA Metrics and achieve better business outcomes while fostering a healthier and more productive team.
Additional Resources
- Oobeya Symptoms Catalog: https://docs.oobeya.io/symptoms/symptoms-catalog
- Optimizing Team Performance in Software Development with Oobeya Team Health Module: https://oobeya.io/blog/optimizing-team-performance-in-software-development/
Previous Articles
- How to Measure DORA Metrics Accurately: https://oobeya.io/blog/how-to-measure-dora-metrics-accurately/
- How To Reduce Lead Time For Changes (Optimizing DORA Metrics): https://oobeya.io/blog/how-to-reduce-lead-time-for-changes-dora-metrics/
- DORA Metrics Tracking: How to Effectively Detect Production Failures: https://oobeya.io/blog/dora-metrics-tracking-how-to-effectively-detect-production-failures/

