Fix the constraint, not just the metric.
Trace delivery delays through work patterns, reviews, rework, and production lead time. Focus improvement where work is actually getting stuck.
Oobeya vs Waydev
Get the evidence to improve delivery, protect quality, and evaluate your AI investment. Oobeya brings developer productivity, engineering performance, and line-level AI Code Attribution into one platform, so technical teams can investigate, managers can prioritize, and executives can invest with confidence.
Why choose Oobeya?
A release is slipping. Review queues are growing. AI spending is up. The question is whether you can understand the work behind the trend and choose the right response.
Trace delivery delays through work patterns, reviews, rework, and production lead time. Focus improvement where work is actually getting stuck.
Inspect AI contribution at line level, then examine spending, review effort, quality, and delivery together. Bring more than an adoption percentage to the investment decision.
Use connected performance, capacity, and quality insights to set priorities. Keep the supporting engineering detail close when a team lead, CTO, or executive asks, "Why?"
Platform comparison
Both platforms cover engineering performance and AI measurement. Oobeya brings inspectable line-level AI attribution into a broad view of delivery, quality, team performance, and investment.
Scroll horizontally to compare both platforms.
| What matters | Oobeya | Waydev — published scope |
|---|---|---|
| AI code attribution | Oobeya records AI/human origin line by line. Supported AI tools: Claude Code, Cursor, GitHub Copilot, Codex, Gemini, Devin, and OpenCode. | Available only to teams using Entire. |
| AI impact & investment | AI adoption, impact across review, rework, quality, productivity, and delivery metrics, token usage, cost statistics, and financial ROI dashboards. | Financial dashboards, token usage, and cost statistics. |
| Productivity & review | Individual, team, and executive insights; work distribution, coding efficiency, churn, review bottlenecks, and recurring delivery symptoms. | Team insights, PR analytics, Signals, and Goals. |
| DORA Metrics | Available. Automatically generated delivery symptoms related to DORA Metrics. | Available. |
| Quality & technical debt | Code quality, in-depth SonarQube findings and charts (Technology Partner), review effectiveness, rework, and defect signals from multiple data sources, including Jira and Azure Boards. | Basic SonarQube quality metrics. |
| Testing & defects | Dedicated manual and automated test analytics, execution results, escaped defects, and issue-level backlog detail. Integrations include Xray for Jira, Zephyr, and TestRail. | Not available. |
| DevEx surveys | 9 ready-to-use survey templates, benchmarks, and engineering data correlation with survey results. | Basic DX survey. |
| Documentation Analytics | Available. Integrates Confluence with engineering data. | Not available. |
| Enterprise deployment | Cloud, private cloud, and on-premise options; local-first AI code attribution. | Cloud, private cloud, and on-premise deployment options. |
| Interface languages | English, Polish, Turkish, Portuguese (Brazil), and Spanish. | Only English available. |
| Support languages | English, Polish, Turkish, Portuguese (Brazil), Spanish, and Chinese. | English and Romanian. |
| Integrations | Project Management & Documentation: Azure Boards, Confluence, Jira, ServiceNow. SCM & CI/CD: ArgoCD, Azure DevOps, Bitbucket, Bitbucket Pipelines, CloudBees, Gerrit, Gitea, GitHub, GitHub Enterprise, GitHub Actions, GitLab, GitLab CI/CD, Jenkins, Octopus Deploy, TeamCity. AI Coding & Attribution: Blamely.ai, Claude Code, Codex, Cursor, Git AI, GitHub Copilot. View allQuality & Security: Fortify, SonarQube Cloud, SonarQube Server, Veracode. Test Management: TestRail, Testinium, Testinium Cloud, Xray, Zephyr. Monitoring / APM: AppDynamics, Azure Application Insights, Dynatrace, Elastic APM, New Relic, Sentry. SSO & Identity: Active Directory, Entra ID, Keycloak, LDAP, Okta, SAML. | Code: GitHub, GitHub Enterprise, Bitbucket, Bitbucket Server, GitLab, GitLab Self-Hosted, Azure DevOps, Azure DevOps Server, AWS CodeCommit, and Gerrit. Ticketing: Jira, Jira Server, Azure Boards, Azure Boards Server, and ClickUp. Quality: SonarQube. |
The Oobeya advantage: broader SDLC tool integrations, technical evidence for the team, and decision-ready context for leadership.
Schedule a DemoAI intelligence
An adoption report shows that a tool was used. It doesn't tell you which parts of a code change came from that tool.
Explore AI Code AttributionOobeya brings AI contribution down to the line. Inspect AI- and human-authored changes, see the contributing assistant and model where captured, and retain the attribution record in Git.
Use that evidence alongside review effort, rework, quality, and delivery. Give technical teams a concrete starting point for investigation and leaders a better basis for evaluating AI-assisted work.
Waydev’s AI code attribution is available only to teams using Entire. That integration passes commit-level totals and percentages. Oobeya records AI/human origin line by line, preserving the evidence behind the totals.
Attribution coverage and model detail depend on the assistant and capture setup.
AI attribution alongside delivery and usage
75,403 of 123,666 added lines are AI-attributed.
158commits/week
36.2min
1,401hours
17developers
An AI bill tells you what you spent. A code count tells you how much was produced. Neither tells you whether engineering improved.
Compare AI spending and attribution with review time, rework, code quality, and delivery trends. See where the evidence supports expanding adoption, and where workflow changes or closer review should come first.
Know what to scale, what to investigate, and what to challenge before the next renewal.
Explore AI ImpactEngineering depth
Follow DORA and lead-time stages through to review delays and recurring symptoms. Separate production releases from non-production activity so leaders see the delivery reality, not just deployment volume.
Bring technical debt, security findings, manual and automated tests, defects, and churn into the same review. Prioritize the quality issues that put reliable delivery at risk.
Compare work distribution, planned effort, team capacity, and project allocation. Spot overload and competing priorities before treating every slowdown as a headcount problem.
Use DevEx surveys, comments, and benchmarks alongside workflow data. Understand friction that activity metrics cannot explain, and choose improvements with the people doing the work.
Engineering performance at a glance
| Member | Impact Ratio | Coding Efficiency | AI Code Share | Work distribution | New Work | Refactor | Help Others | Churn |
|---|---|---|---|---|---|---|---|---|
 Maya PatelSeniorGo to Individual Scorecard | 2.4x | 94% | 36% | 52% | 25% | 17% | 6% | |
 Alex MorganMidGo to Individual Scorecard | 1.6x | 92% | 48% | 38% | 34% | 20% | 8% | |
 Sam TaylorMidGo to Individual Scorecard | 0.8x | 80% | 76% | 47% | 18% | 15% | 20% | |
 Jordan LeeJuniorGo to Individual Scorecard | 0.6x | 72% | 84% | 20% | 30% | 22% | 28% |
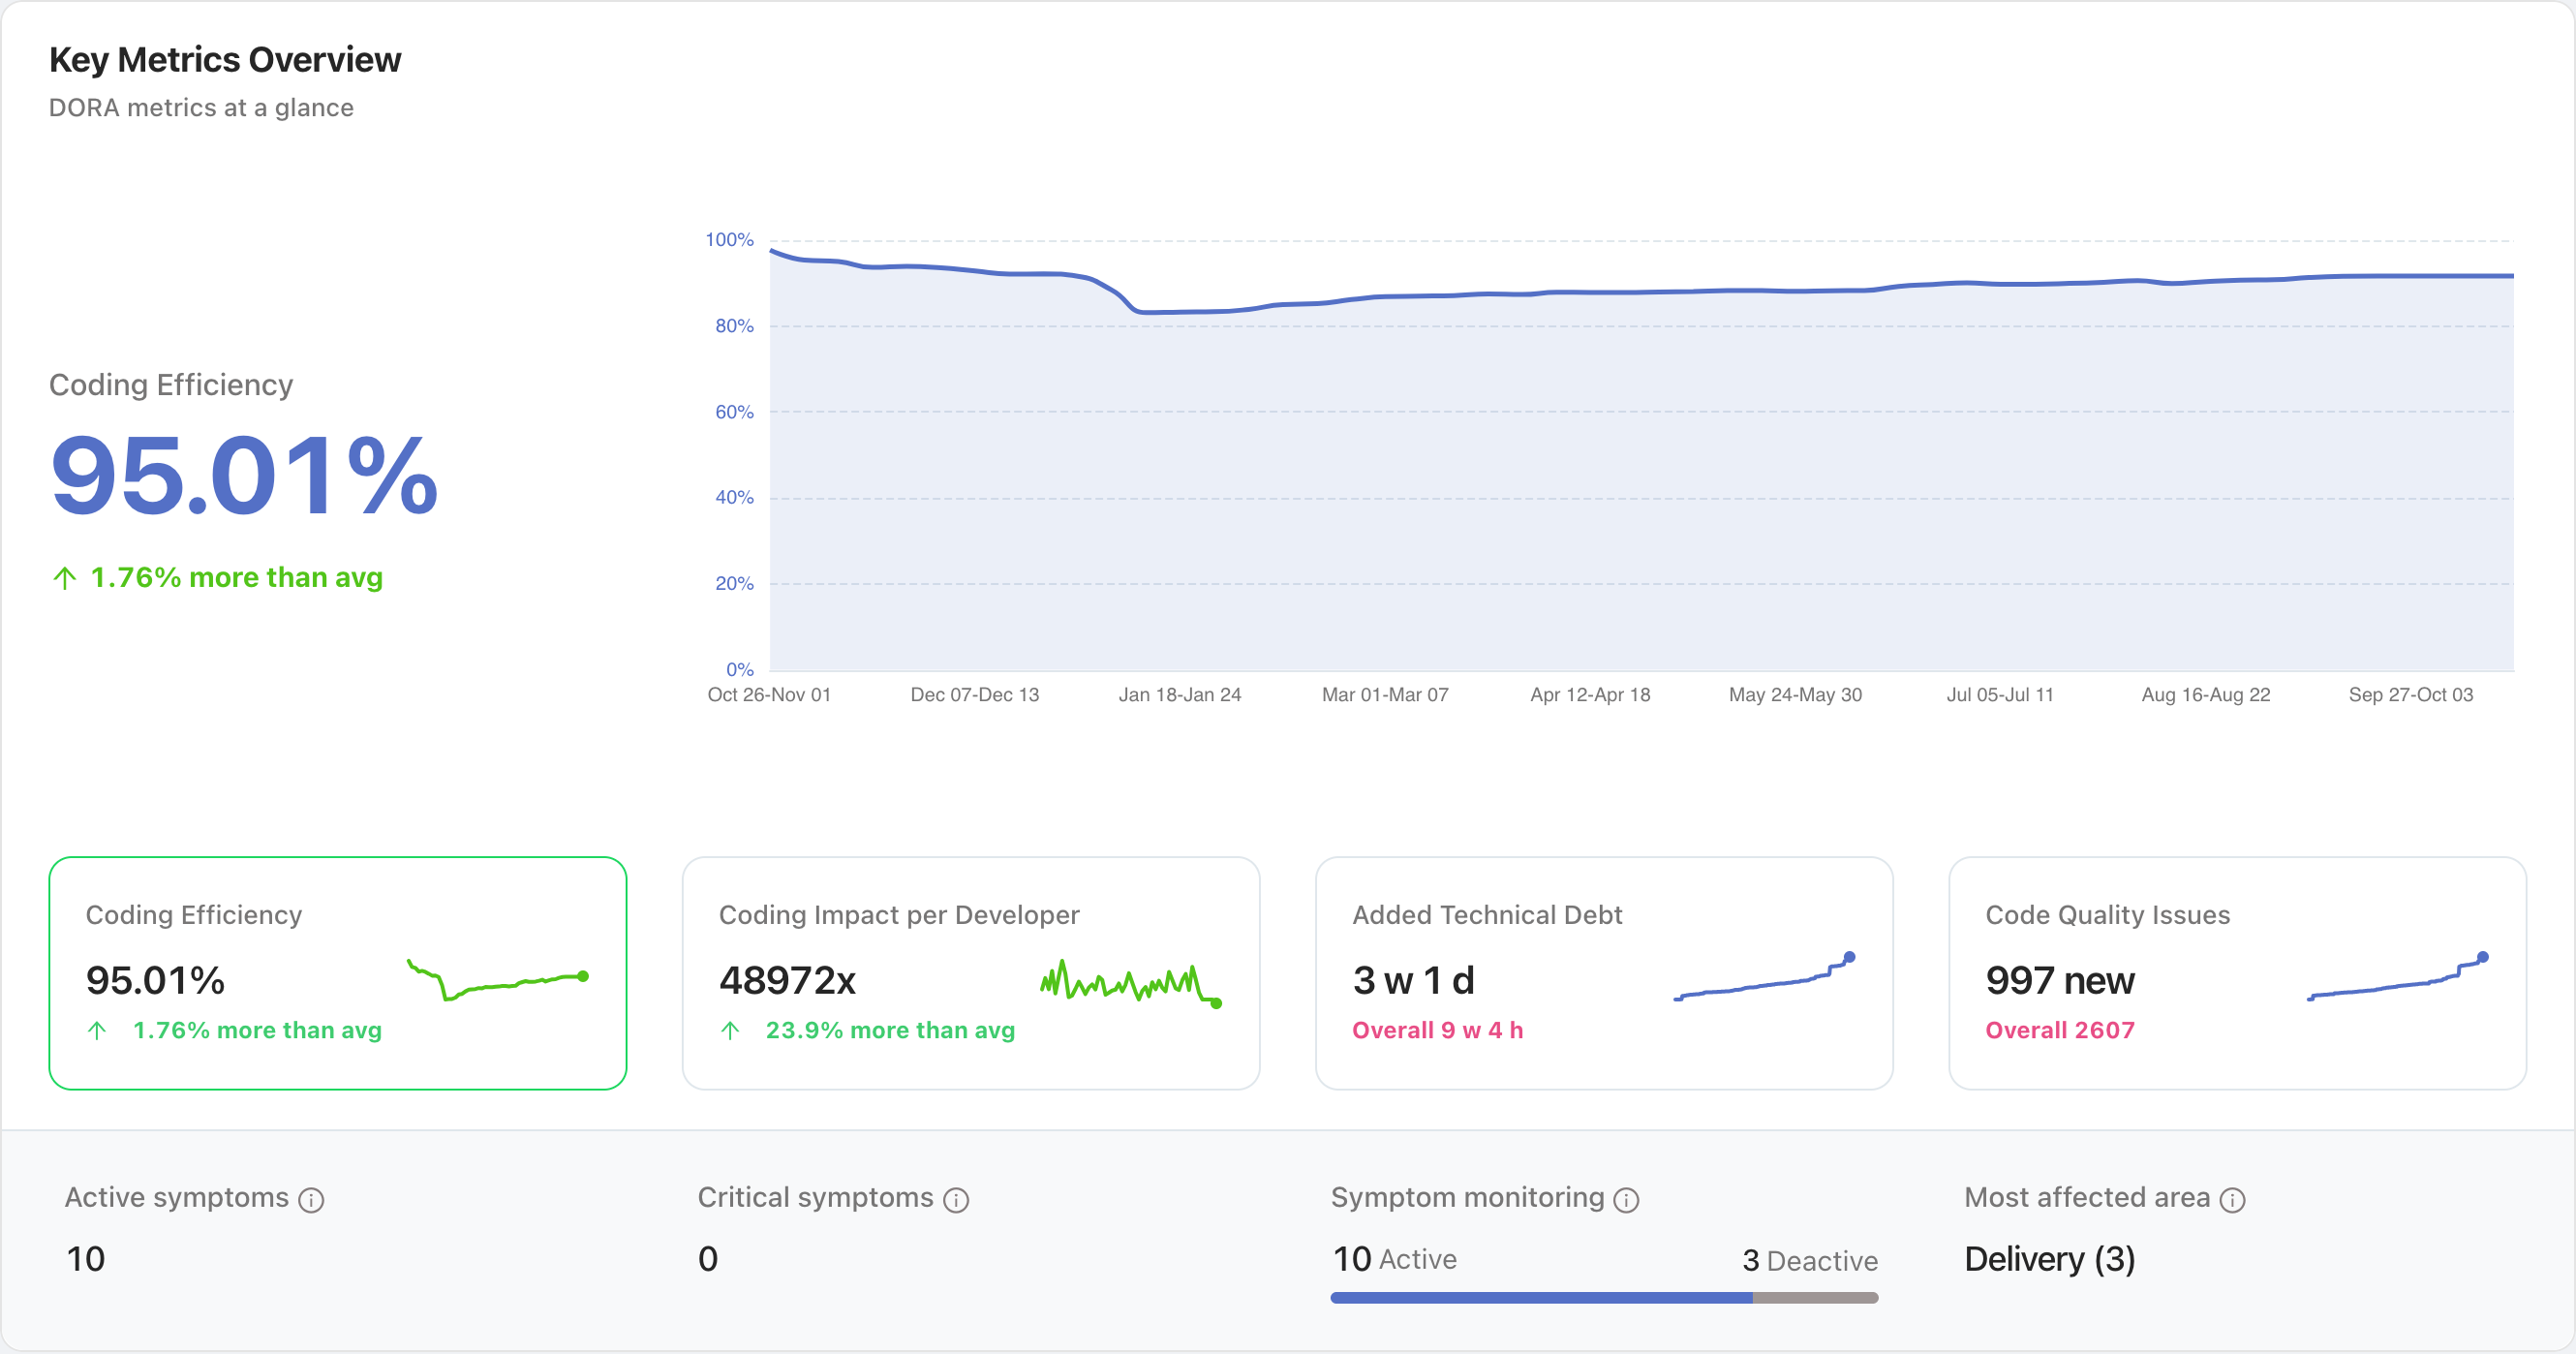
Coding efficiency recovered to 95.01%, above the company average.
Leadership value
Review delivery confidence, quality risk, capacity, and AI value. Use executive summaries to focus the discussion, with the engineering context behind the recommendation.
Decide whether to focus on review queues, rising rework, overloaded teams, or an AI rollout that needs support. Set improvement priorities and follow the results.
Examine the reviews, pipelines, tests, quality findings, and attributed changes behind the trend. Keep decisions grounded in the work, not an isolated productivity score.
Enterprise fit
Oobeya supports enterprise engineering organizations across banking, insurance, telecommunications, retail, and technology. Bring repositories, work tracking, CI/CD, quality, and testing into a shared view while keeping the tools your teams use.
Choose cloud, private cloud, or on-premise deployment, with SSO, role-based access, and audit logging to support your security requirements.
Enterprise-wide visibility. Engineering-level detail.
Common questions
Choose Oobeya when you want line-level AI evidence and engineering-wide visibility together. Connect code attribution with productivity, delivery, quality, testing, developer experience, and capacity. Your technical teams get the depth to investigate; your leaders get a clearer basis for action.
It makes the next action more specific. A delivery slowdown might call for better review coverage, less rework, or a change in priorities rather than more headcount. Oobeya brings the relevant signals together so leaders can investigate the constraint before committing people or budget.
Oobeya records AI/human origin line by line, with assistant and model details where captured. Waydev’s AI code attribution is available only to teams using Entire, which provides commit-level totals and attribution percentages. Oobeya gives your team a record it can inspect beyond the summary.
Oobeya brings AI spending, attribution, and changes in engineering outcomes together to support an ROI assessment. Review effort, rework, quality, and delivery add context to the investment. These signals do not establish causality or a financial return on their own; dollar-based ROI also needs explicit benefit assumptions and a consistent baseline.
Coverage includes GitHub Copilot, Cursor, Claude Code, and Codex, with additional assistants supported through Blamely. Attribution, usage, and cost coverage vary by integration. The demo will show what is available for your toolchain and how the signals are captured.
Oobeya covers planning, developer productivity, review flow, DORA, code quality and security findings, technical debt, testing, defects, developer experience, and resource allocation. Use that broader picture to understand delivery and the conditions behind it, rather than judging teams by code volume alone.
Both. Executives review performance, investment, and risk. Engineering managers investigate constraints and improvement priorities. Technical teams inspect the underlying work. Shared engineering context makes it easier to explain a recommendation and agree on the next action.
Oobeya integrates with source control, work tracking, CI/CD, quality, and test tools. Cloud, private-cloud, and on-premise options are available. Use the demo to confirm your integrations, reporting scope, access controls, and deployment model.
Bring a delivery bottleneck, a quality concern, and an AI investment question. Ask each platform to show the underlying evidence, explain its metrics, and demonstrate the decisions those insights support. For AI attribution, ask to inspect actual attributed lines, not only a percentage.
Bring a delivery challenge, an AI investment question, or a team-performance concern. See how Oobeya connects the detail your teams need with the answers your leaders are looking for.
Schedule a DemoA walkthrough focused on your priorities, your toolchain, and your decision-makers.
All comparisons