Elite
Best-in-class performance. Healthy, scalable, and sustainable engineering practices.
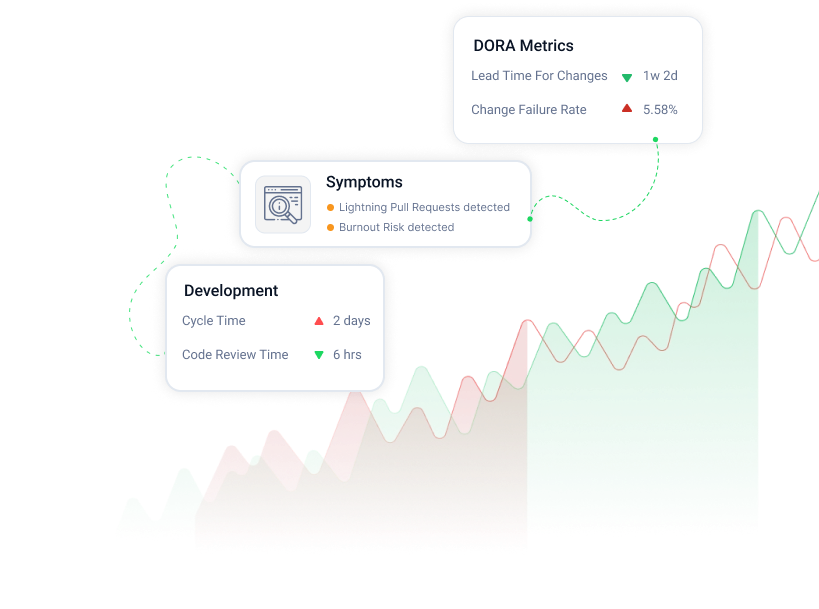
Standardized performance thresholds for key engineering metrics. Compare teams fairly, identify improvement areas early, and create a shared language between engineering and leadership.
Best-in-class performance. Healthy, scalable, and sustainable engineering practices.
Acceptable performance with clear improvement potential. Often the highest ROI area.
Below expected performance levels. Indicates delivery, quality, or reliability risk.
| Metric | Elite | Needs Focus | At Risk |
|---|---|---|---|
Actual Reaction Time Time from item entering sprint backlog until work begins. | < 5 days | 5-10 days | > 10 days |
Cycle Time Time from In Progress to completion for completed tasks. | < 3 days | 3-10 days | > 10 days |
Lead Time Creation to completion time. Lead Time = Reaction Time + Cycle Time. | < 7 days | 7-14 days | > 14 days |
Predictability (Completed items / Planned items) x 100. | > 90% | 70-90% | < 70% |
Don't just read tables. Ask Oobeya why a metric is At Risk, what's driving the trend, and how to improve. Get contextual, explainable answers powered by AI.
You 11:05 AM
Which teams are At Risk on code review cycle time, and what's causing the delays?
Oobeya 11:05 AM
Teams B and D are At Risk with cycle times above 7 days. Main drivers are oversized PRs and low reviewer availability. Reducing PR size and balancing review ownership can move both teams into Needs Focus within 2 sprints.
Engineering Benchmarks define what good looks like. Oobeya Gamification turns those benchmarks into actionable KPI targets with thresholds.
↓ 33%
reduction in
Production Defects
↑ 121%
increase in
Unit Test Coverage
↑ 95%
increase in
Code Review Efficiency
↑ 30%
increase in
Coding Efficiency
KPI Targets
Replace vague expectations with explicit targets teams understand.
Thresholds & Ranges
Evaluate KPIs using consistent ranges like Elite, Needs Focus, and At Risk.
Leadership Conversations
Create governance-friendly performance discussions across teams and orgs.
A practical guide for CTOs, VPs, engineering managers, and platform teams who want to connect DORA metrics with flow, quality, and planning data.
Benchmarks FAQ
Clear answers for engineering leaders evaluating benchmark thresholds, performance interpretation, DORA context, and how Oobeya helps turn benchmarks into practical decisions.
Software engineering benchmarks are reference thresholds that help teams interpret metrics such as cycle time, review speed, delivery flow, and other engineering performance signals. They give leaders a clearer sense of what looks healthy, what needs attention, and what may indicate risk.
You are safe with us


